
Tuesday, July 31, 2012
Nifty Elliott Wave analysis for 31-07-2012
Elliott wave count on Daily chart:

Elliott wave count on 5 min chart:
This can be viewed in two ways. Current labeling is a completely bullish one though with (i),(ii) completed and (iii) in progress. Though this can also be labeled as (a),(b) and (c) in progress. We need to closely watch the next development of the Nifty. There may still be a large down move left to complete the large B.

Nifty Heikin Ashi candle chart for 31-07-2012
Daily Hekin Ashi chart:
 Nifty has formed a large hollow blue candle after a small hollow candle. Latest candle do not have lower shadow and the real body is huge. This is a strong sign of up trend continuation.
Hourly Hekin Ashi Chart:
 Throughout the day none of the candles contained any lower shadow. All the candles were hollow blue and had reasonable real body. This is again a strong sign of up trend continuation.

Hourly Hekin Ashi Chart:

Nifty Boillinger Bands for 31-07-2012
Daily Boillinger Band:
 Nifty has moved above the middle point and closed comfortably above it. It may target a minimum of the upper boundary of the Boilinger band which is currently at 5255.44 and rising. Lower boundary is at 5008.22 and middle point is at 5131.83. Middle point may pose support in the case of extreme fluctuations today.
Hourly Boillinger Band:
 Whole of the day Nifty stayed comfortably above the middle line and is slightly below the upper boundary which is sharply rising. This may continue for some time too.

Hourly Boillinger Band:

Friday, July 27, 2012
Nifty Elliott wave count update for the end of the day for 27-07-2012


Nifty Elliott wave analysis for 27-07-2012
Nifty Elliott wave count on daily chart:

Nifty Elliott wave count on hourly chart:
 Nifty Elliott wave count on 5 min chart:


Nifty Elliott wave count on hourly chart:


Nifty Heikin Ashi candle chart for 27-07-2012
Heikin Ashi Daily candle chart:
 Heikin Ashi hourly candle chart:

Currently both daily & hourly mode is down. Both have formed large red candles without upper shadow. This indicates strong down trend. however we need to observe the market strength near 4990 range.


Currently both daily & hourly mode is down. Both have formed large red candles without upper shadow. This indicates strong down trend. however we need to observe the market strength near 4990 range.

Thursday, July 26, 2012


Nifty Elliott Wave Analysis for 26-07-2012
Elliott wave count on daily chart:
 Nifty Elliott Wave count on hourly chart:
 Nifty Elliott wave count on 5 min chart:


Wednesday, July 25, 2012


Nifty Hekin Ashi intraday update for 25-07-2012

Nifty Intraday Elliott wave update for 25-07-2012
Elliott wave count suggest that the fifth wave of C is over at the bottom 5076.60. This is also confirmed by the RSI divergence that we see in the cart. However a move past 5095 decisively or a close above 5090 by 1 pm can give more confirmation for us.
Elliott wave count on 5 min chart


Elliott wave count on 5 min chart


Nifty Heikin Ashi candle charts for 25-07-2012
Daily Heikin Ashi candle chart:
 Hourly Heikin Ashi candle chart:


Nifty Elliott Wave analysis for 25-07-2012
Nifty Elliott Wave daily count
shows that it is still short of another 25-30 point to complete the wave C (of
wave a?). However if the current bounce amounts to wave iv of the C then we can
even count the complete movement of yesterday as an irregular b wave of iv as
shown in the 5 min wave chart below.
This may go up to 5075 range,
however restricting it self to 5090 range will be more desirable. But a=c
equality may take it to the former range.

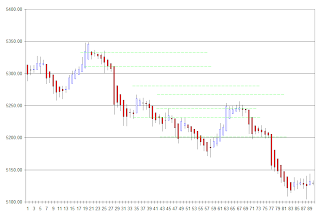
To see the things little
simpler way, I have created a line chart of the closing price of each day. This
makes the labeling lot simpler :-)

Hourly count is shown below:

Elliott Wave count of this correction
is detailed in the 5 min chart analysis below.
Elliott wave count for Nifty 5
min chart:
Elliott Wave count suggests that Nifty is currently
forming the ‘C’ in an impulsive move down. So far it has completed i,ii, iii
& iv . [Alternatively we can also view that the truncated fifth wave was
completed yesterday at 5103.65] A dip to 5075-90 range may confirm the wave v
(five). This may complete the wave ‘C’ (of ‘a’?). Then market should be heading
high
One more interesting point to observe it the Bullish Harami Cross formation yesterday in the daily chart
Tuesday, July 24, 2012
Nifty formed a harami cross at the end of the day 24-07-2012
Nifty seems to have formed the bullish harami cross in the candlestick chart. Also it is at the bottom of the daily Boillinger Band. This might be a trend reversal point. However a white candle tomorrow will confirm it [though confirmation may not be necessary]
The possibilities are that market may open gap up as well.

The possibilities are that market may open gap up as well.


Nifty Elliott Wave update for 24-07-2012
During the current fall whether Nifty has completed the five wave down or has just finished 3 waves and 4th wave and 5th wave are still under development? Well we shall get the confirmation of this today with a small bounce to near 5150 range and a dip to 5090 range and then a reversal to upwards. If the market continues beyond 5150 without dip then 5 waves are completed.


Monday, July 23, 2012
Income tax slab 2011-2012
Income tax slab rates for Year 2011-2012. This tax table based on the latest income tax slab is a ready reference for calculating your income tax for year 2011-12. Quick highlights
- Base slab for general tax payers increased to 1.8 lakh from original 1.6 lakh
- Senior citizen age reduced to 60 years from last years 65 years. Senior citizen now include people between 60 and 80 years. Also increased the base slab for senior citizen to 2.5 lakh from previous years 2.4 lakh
- A new category called "Very Senior citizen" added for people above 80 years.
Income tax slabs 2011-2012 for General tax payers
| Income tax slab (in Rs.) | Tax |
|---|---|
| 0 to 1,80,000 | No tax |
| 1,80,001 to 5,00,000 | 10% |
| 5,00,001 to 8,00,000 | 20% |
| Above 8,00,000 | 30% |
Income tax slabs 2011-2012 for Women
| Income tax slab (in Rs.) | Tax |
|---|---|
| 0 to 1,90,000 | No tax |
| 1,90,001 to 5,00,000 | 10% |
| 5,00,001 to 8,00,000 | 20% |
| Above 8,00,000 | 30% |
Income tax slabs 2011-2012 for Senior citizen (Aged 60 years but less than 80 years)
| Income tax slab (in Rs.) | Tax |
|---|---|
| 0 to 2,50,000 | No tax |
| 2,50,001 to 5,00,000 | 10% |
| 5,00,001 to 8,00,000 | 20% |
| Above 8,00,000 | 30% |
Income tax slabs 2011-2012 for Very Senior citizen (Above 80 years)
| Income tax slab (in Rs.) | Tax |
|---|---|
| 0 to 5,00,000 | 0% |
| 5,00,001 to 8,00,000 | 20% |
| Above 8,00,000 | 30% |


Nifty Intraday Elliott Wave analysis for 23-07-2012
Did it complete the wave c down and started the up move? Seems to have touched the 5122 range and now heading up?Nifty hourly chart :


Subscribe to:
Posts (Atom)