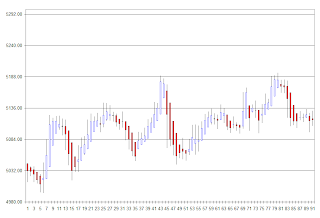
Nifty did not start impulsive move yesterday. Hence our earlier view and wave count is mostly negated.
Alternate counting looks like a contracting triangle might be in play starting from 5189.40. However there is one wave 'c' within this is counted as 1-2-3-4-5 but as per triangle rules all 5 waves should be 3-3-3-3-3. A closer look at this wave 'c' may help us to validate the count.
Another alternative which is already counted before is that a flat correction from 5189.40 which supposedly ended with a truncated 5 wave near 5095.55. For this to be still valid we should see a leading diagonal for wave '1' of the impulse 'C'. This will have an internal wave count as 5-3-5-3-5. So far the move from 5095.55 to 5158.85 can be counted as a 5 wave and the correction followed after that was a clear 3 wave a-b-c.
One more alternative is that the wave 'C' itself is developing like an ending diagonal. For the time being we shall not pursue this option. When more evidences emerge then let us validate this.
At this stage we are keeping both the options open and let the market validate and guide us.
Option 1 - Market may have to move down a bit and touch the developing line somewhere near 5100-5120 [mostly near 5110] range and then bounce like crazy.
Option 2 - Start another 5 wave upmove from current position itself.
Nifty Elliott Wave analysis of hourly chart:
Nifty Elliott Wave analysis of 5 min chart:
Nifty Pivot Table


