Friday, August 31, 2012

Nifty analysis

"Since my laptop is not functioning, I will not able to generate the charts for today. As soon as it is corrected, I'll post the charts".

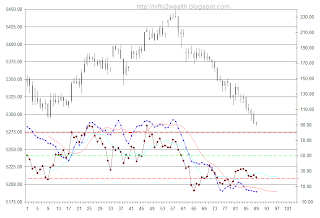
Yesterday the final dip seemed to have completed a 5 wave down move. This could be wave 'a' of the a-b-c correction or wave 1 of the larger down move. We shall wait and observe the strength of the move to confirm this. In any case this indicated that market will bounce in the short term.

Let us keep a close watch on the fibonacci retracement levels for the current fall from 5448.45 to 5255. A possible range could be 61.8%

Start

End

Length

23.60%

38.20%

50.00%

61.80%

73.60%

80%

5448.45

5255

-193.45

5300.65

5328.90

5351.73

5374.55

5397.38

5409.76


Yesterday market took support at 50 day SMA. This is an important level.

Wednesday, August 29, 2012

Nifty Camerilla levels for 29-08-2012


Nifty Boillinger Bands for 29-08-2012

Daily chart:
Hourly chart:


Nifty Elliott Wave analysis for 29-08-2012

Nifty dripped further towards 5312.75 and did a small bounce. Nifty might have completed the wave 'a' of the correction and it might retrace this fall in wave 'b'. We can observe a positive divergence in the hourly chart for 9 RSI and 35 D.

I have added a new chart in the daily charts list with a possible labeling for the bigger picture. It may be that we are in an ending diagonal in wave C of wave B. We can refer to the monthly count as well for reference.

We shall observe how will Mr. Market move for this expiry week where we have only two days left. This week is also important as this is the week to assert the weekly as well as monthly trend. Both have turned up few day ago but is interesting to see whether it will remain that way or will turn down. For it to remain in the up trend we have to move up in the minor wave 'b' as a retracement to the last three day's fall.

Nifty Elliott wave labeling on daily chart: - Alternate counting for the bigger picture:


Nifty Elliott wave labeling on daily chart:
Nifty Elliott wave labeling on hourly chart:
Nifty Elliott wave labeling on 5 min chart:
Skipped this chart as the labeling is not convincing.

Nifty hourly chart with 9 RSI and 35 D:
Observe the positive divergence emerged late in the afternoon yesterday. We need to see how this will pay out today. Will it give a reasonable bounce in wave 'b'?


Nifty Heikin Ashi candle chart for 29-08-2012

Daily chart:
Hourly Chart:


Tuesday, August 28, 2012

Nifty Pivot Table for 28-08-2012


Nifty Camerilla levels for 28-08-2012


Nifty Elliott Wave analysis for 28-08-2012

Nifty probably in the final sub wave of the currently on going correction. This could only be a wave 'a' of the correction for the up move from 5033 to 5444.45. So far it has retraced up to 23%. If the earlier move was wave 1 then this retracement can be anywhere between 38.2% to 61.8% [though even higher retracement is completely acceptable]. Which means we may see a bounce now and another sell off again.

Current down move can be read as an impulse 1-2-3 [it can also be read as an a-b-c as indicated in the hourly chart]. The move down from 5395.35, the high of yesterday looks like an ending diagonal. It do not have the fierceness as expected. Internal wave counts also confirm this 3-3-3-3-3 movement. Only thing to notice is the end of wave 'e' is slightly below the line connecting the end of wave 'a' and wave 'c'. This is mostly possible. Hence I would believe it is an ending diagonal.

Oversold hourly indicators suggest that there could be a minor bounce possible at this stage [or it may take another dip for a new low before commencing the bounce] Check out the 9 RSI and 35 D chart at the end.

If the above observation is to be accepted then we should see a bounce today morning to retrace the move from 5444.45 to 5346.80.


From
To
Fall/Rise
23.60%
38.20%
50%
61.80%
73.60%
80%
5448.45
5346.8
102
5371
5386
5398
5410
5422
5428
5032.8
5448.45
(416)
5350
5290
5241
5192
5143
5116


Nifty Elliott Wave analysis on daily chart:


 Nifty Elliott Wave analysis on hourly chart:
Nifty Elliott Wave analysis on 5 min chart:


Nifty hourly chart with 9 RSI and 35 D:

Nifty Heikin Ashi candle chart for 28-08-2012

Daily chart:
Hourly Chart:


Monday, August 27, 2012

Nifty Boillinger Bands for 27-08-2012

Daily chart:
Hourly chart:


Nifty pivot table for 27-08-2012


Nifty Camerilla pivot levels for 27-08-2012


Nifty Elliott Wave analysis for 27-08-2012

Nifty was expected to move near to 5350 range to complete the 5 wave decline which will mark the wave 'a' of zigzag. However so far it came near to 5371 and spent a lot of time consolidating without much of retracement. This type of movement is quite observed in the 4th wave. This may be an indication that another small dip is expected before a retracement in wave 'b' of the zigzag.

Ultimately Mr. Market is the supreme. We shall observe the clues to see the possible movement.

Elliott wave labeling on Nifty daily chart:
Elliott wave labeling on Nifty hourly chart:
Elliott wave labeling on Nifty 5 min chart:
9 RSI and 35 D on Nifty hourly chart:


Nifty Heikin Ashi candle chart for 27-08-2012

Daily chart:
Hourly chart:


Friday, August 24, 2012

Nifty Pivot table for 24-08-2012


Nifty Elliott Wave analysis for 24-08-2012

Nifty seems to have completed the 5th wave yesterday and commenced the next correction. Now this 5th is the end of wave C or is the end of wave 1 of wave C is to be confirmed. This is discussed in length yesterday.

Nifty daily Elliott Wave chart:
The current 5 wave advance can be viewed as a leading diagonal as well, which is 5-3-5-3-5. This implies that the current move can be only wave 1 of the five waves of wave c. In such case the current correction should not go beyond 5033, which is the begining of wave 1.

Nifty hourly Elliott Wave chart:


Nifty seems to have done wave 1 of the 5 waves of the wave a of this a-b-c correction.

Nifty 5 min chart with Elliott Wave labeling:
Of the 5 wave move down, wave 3 seems to have sub divided and the 5 waves of this sub divisions are over. Currently Nifty might be correcting the 1-2-3 which is done so far as the wave 4. Wave 5 might still be pending and which might again sub divide to reach somewhere near the 5350 range which is 28% retracement of the current rise from 5033 to 5448.45.


Nifty hourly chart with 9 RSI and 35 D:
Multiple negative divergences, it is quite well uncovering now in the form of the down move.


Nifty Camerilla pivot levels for 24-08-2012


Nifty Heikin Ashi candle charts for 24-08-2012

Daily chart:
Hourly Chart:


Thursday, August 23, 2012

Nifty pivot table for 23-08-2012


Nifty Bollinger Bands for 23-08-2012

Daily chart:
Hourly chart:


Nifty Camerilla pivot levels for 23-08-2012


Nifty Elliott Wave analysis for 23-08-2012

Nifty seems to be in the final stage of the 5th of the 5th wave of C or 1 [to be confirmed by the market]. Now if this is correct labeling then market should not move beyond 5397 for this up move to have one more bounce today. As discussed yesterday the recent shape of the chart is not very convincing and the wave labeling is not satisfactory. Hence we need to keep in mind about the underlying risk and manage it well.

So far the market/chart shape is not convincing for a complete reversal as the wave C is not complete [equality of a=c has a target of at least (5630-4531= 1099) i.e 4770 + 1099 = 5869. Also another way to get the target is the minor waves of the current wave C i.e wave a (5349 -4770=579), 5033+579 = 5612]
As per this any correction could be retracement for the recent up move. This should not move beyond 5033 to remain in the up move.


Daily as well as hourly charts are showing negative divergence since few days and this may bring down the market anytime. So let us be prepared. How much will it go down? This is a question that only market can confirm us.

So far the market movement appears like market is buying more time to complete the up move in terms of time before the up move target in terms of price is complete.

Nifty Elliott wave labeling on daily chart:
Nifty Elliott wave labeling on hourly chart:
Nifty Elliott wave labeling on 5 min chart:
Yesterday afternoon movement appears like market is in the minute 4th wave and is shaping like an irregular correction with wave b moving beyond the origin of wave a. Current wave c is forming like an impulse. Probably the 5 wave move down is complete.

Nifty 9 RSI and 35 D on hourly chart: