Friday, September 28, 2012

Nifty Elliott Wave analysis for 28-09-2012

Nifty almost made a double bottom (5638.90 & 5640) yesterday, as seen in hourly chart.

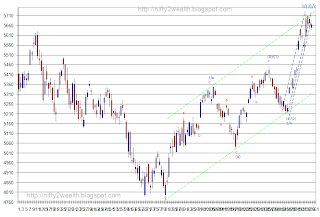
Nifty also appears to have completed the 4th wave with this as a double zig-zag. Now market can move up to complete the wave 5 of wave 3 of wave c.
Daily chart:


Hourly chart:


As usual - our study of ATR vs. market is shown in the below chart. We can see that ATR crossed its trigger line and moved up yesterday.

Thursday, September 27, 2012

Nifty Hekin Ashi candle chart for 27-09-2012

Daily chart:
hourly chart:


Nifty Elliott wave analysis for 27-09-2012

Nifty was range bound for the entire day yesterday. It seems to have got support near the developing 5 Day EMA around 5636 - 5645 range. It has also given a positive divergence in the 9 RSI in hourly chart. Only concerning factor in the daily chart the 9 RSI has crossed below the trigger line. If the market turns up violently then this will again cross over above the trigger line. Another interesting factor to observe is, this being the counter trend move, the 14 RSI (hourly chart) has rebounded from 40 range. (actually near 35)

This can be treated as completion of wave 4 of wave 3 of wave C.
Now this gives hope for the the wave 5 of the 3 of C upwards near the 5750 range.

Nifty Daily chart with Elliott Wave labeling:
Hourly chart:
Nifty 9 RSI and 35 D on hourly chart:


As a continuation of my study on ATR co-relation to Nifty movement, I have attached the last chart with 7 point ATR and the trigger line. Yesterday it has almost kissed the trigger line. In fact it has done that twice in the current correction phase.


Wednesday, September 26, 2012

USDINR Elliott Wave analysis for 26-09-2012

USDINR pair seems to have completed a correction at yesterday's low near 53.3056. Now it might start a journey up. This could be either wave b of wave 2 or it is the beginning of another impulsive move up. In either case it may retrace a minimum of 61.8% of the recent fall. If this is the 3rd wave, then it will be more violent and will travel a large distance in s very short span of time.

The correction a-b-c had an impulse in wave a. A beautiful triangle in wave b. Another impulse in wave c. This most likely confirms that the current correction is over.

Nifty Elliott Wave analysis for 26-09-2012

Nifty continued the correction and confined to below 5700. So I have reworked the entire correction phase starting from 5719. The labels are updated in the hourly chart. We maybe still in the correection which might take us to near 5600 range before promising any meaningful bounce. So far it has completed wave a and wave b of the wave iv. Wave c should take it to re-test the channel bottom.


Daily chart:


Hourly chart:


Another interesting observation that I had was plotting the 7 day ATR and a trend 9 day moving average of it as trend line against the hourly nifty. I had observed that whenever the trend line cross over happens, market moves in a direction. This is just a study and posted it for observation. Need to review this for a larger set of data and backtest it.


Tuesday, September 25, 2012

Gold Elliott wave analysis for 25-09-2012

Gold seems to have one set of a-b-c correction at the low of yesterday around 31320. This could be wave a or wave 4. We are yet to determine that. It seems to have started a move up. This could be the next leg of the impulse of is part of the wave b. We should observe the strength and nature of this up move to confirm.

Gold Daily chart :
Gold hourly chart:


Nifty opening update 25-09-2012

Nifty opened high and touched nearly 5700. The current formation is well fitting into the contracting triangle of Elliott Wave. This has the lower channel line support near 5660 area. If market bounce from here then we can assume that the wave 5 of wave 3 of wave C up has started. This should break 5680-90 upper channel line decisively.

Nifty Elliott Wave analysis for 25-09-2012


Nifty is consolidating after the big rise to 5719. Going by the nature of this correction, it appears like a triangle of which wave a-b-c are almost over and wave d & e might be pending. This leads us to think that the current move might be the 4th wave of the 3rd wave [or wave c] of the wave C. Which means a small rise above 5720 to near 5750 range [as per the daily chart - channel resistance zone] might be pending. Following which a major correction in wave 4 [or wave d] of wave C.


However one important observation to note at this stage is - hourly 9 RSI & 35 D chart has shown a clear negative divergence. Even then I feel a small bounce can still be possible, given the strength of the market and shallow nature of the current correction.

Daily Elliott wave analysis for Nifty :
Hourly Elliott wave analysis for Nifty :


Nifty hourly chart with 9 RSI & 35 D:
Nifty daily chart with 9 RSI:
RSI is in the verge of cross over on its trend line or the triggering line to indicate a down move.


Nifty Heikin Ashi candle chart for 25-09-2012

Daily chart:
Hourly chart:


Saturday, September 22, 2012

Gold Elliott Wave analysis for 22-09-2012

After a long time, I got a chance to review the Gold chart. Since I have only recent data about gold, I'll analyze only the short term wave counts.

Since July Gold seems to be in a impulsive up move from 29000 range. Considering this as the starting of the impulse wave up, we completed wave i near 29870 range and a shallow wave ii completed around 29570 range. Next wave up in wave iii seems to subdivide and possibly completed all the 5 subwaves of it near 32440 range 7 days ago. Since then Gold is in a correction mode and 31625 range. This could be wave a or wave i. Next gold market has retraced upwards until 32130 which is approximately 61.8% retracement of the fall from 32440 to 31625. This could be marked as wave b or wave ii. Henceforth Gold is in a down move again. This is unfolding as impulse form. This could be wave c or wave ii of wave a. We shall wait and watch how the retracement unfolds from then on. If it unfolds like an aggressive impulse move up then it might be the beginning of the 5th wave up.

Gold daily chart with Elliott Wave labeling:


Gold hourly chart with Elliott Wave labeling.


Friday, September 21, 2012

Nifty intraday update for 21-09-2012

Nifty seems to have completed the wave 5 of wave 3 of wave C up. It has also reached the channel top of hourly channel, daily channel as well as weekly channel. Though there seems to be few points left in daily and weekly channel. Hourly channel shows over shoot which is the indication of the strength of the impulse move up.

Now nifty may correct in an a-b-c to complete the wave 4 of the wave C [or wave d of wave C as in the alternate options discussed today morning.].

Nifty Boillinger Band 21-09-2012

Daily chart:
Hourly chart:


Nifty Elliott Wave analysis for 21-09-2012

Nifty did a dive yesterday till 5542 range. This mostly completes the wave 4 [or a minor dip may be waiting till 5520 range in wave 5 of wave c of wave 4 down]. 19th September move was a triangle in wave b of wave 4. It was very tricky and if spotted properly would have given a handsome profit. I have given the Elliott wave labeling of it in the 5 min chart below.

On the daily chart I have given an alternative label for the current movement. It is very interesting and projects a very bullish outlook till the year end or some where near the mid or end of November. It is self explanatory in the below chart. As per this , the current move up can still be viewed as an ending diagonal with mostly the outer boundaries running like parallel lines with a minor convergence. Most important aspect is the internal structure or the sub waves fitting like text book 3-3-3-3-3 at least until the wave c [blue].

In the same chart I have given the alternate count showing it purely as an impulsive move numbered 1-2-3-4-5.

In either case it may appear like a bullish outlook up and until end of this year reaching the zone of 5900 - 6000.

Nifty Elliott wave analysis of daily chart:
Nifty Elliott wave analysis of hourly chart:

Nifty Elliott wave analysis of 5 min chart:


Nifty 9 RSI and 35 D on hourly chart:
9 RSI Oscillator [red colored line] indicates that the market has reached the over sold region. It is yet to trigger an up move by crossing over its trigger line. If market moves a little up today morning, then it can trigger the up move.


Nifty Heikin Ashi candle chart for 21-09-2012

Daily chart:
Hourly chart:


Tuesday, September 18, 2012

Nifty Boillinger Band for 18-09-2012

Daily chart:
Hourly chart:


Nifty Elliott Wave analysis for 18-09-2012

Nifty gaped up at the opening and reached the resistance zone near 5645-55 and turned down. Yesterday's high might have completed the wave 3 of 3. Current down move is part of the wave 4 of 3. As discussed yesterday, this move might reach the 38.2% retracement level near 5548 - 5560 range.

Yesterday's movement appeared like a zig-zag with waves a & b are completed and wave c is in the progress. This may reach the channel bottom as shown in the hourly chart. As being the 4th wave it may briefly overshoot the channel bottom as well.

Daily chart with Elliott Wave labeling:

Hourly chart with Elliott Wave labeling:

Daily chart with 9 RSI:

Hourly chart with  9 RSI and 35 D:

Nifty Heikin Ashi candle chart for 18-09-2012

Daily chart:
Hourly chart:


Monday, September 17, 2012

Nifty intraday update 17-09-2012

Nifty seems to have taken resistance near the 61.8% retracement zone of the entire fall fro 6339 to 4531 near 5649 (5643) range. This is also a strong resistance zone as shown in the Nifty weekly chart. Nifty can go up to near 5900 range in future days but it has to clear the hurdle now. Staying above 5649 firmly will confirm the up move. However in the immediate term it may be little tired and may rest for short term.

Nifty Boillinger Bands for 17-09-2012

Daily chart:


hourly chart:

Observe how beautifully market moves, bands narrow down and then expand. We can correlate them to Elliott wave labeling. This can give confidence to the labeling.

Nifty Elliott Wave analysis for 17-09-2012

My earlier interpretation of the market - ending diagonal in the wave c was proved wrong by the market. Now I have reworked the labeling.

Rest everything remains the same, re working is done only for the current market movement to up, in the wave c. It appears like we are in the strong impulsive move and waves are sub-dividing. Currently we are in the wave 3 of 3. Last friday's move up with the gap up opening was the strong indication of the impulse move, especially this is the characteristics of the 3rd wave.

We have completed the wave 1, 2. Wave 3 is extending and is subdividing. Currently it has completed the 3rd wave of the 3rd wave. Which means now it may correct in wave 4 till the channel level and then move up to complete the wave 5 of 3rd wave. So far all the corrections within this wave 3 are of very minor in nature, retracing less than or equal to 23.6%. If the guidelines of alteration is to be applied then we may see a slightly deeper correction in the wave 4, may be up to 38%. Holding 50% or 62.8% is the key for this up move. 

Then we can see another correction after completing this 5 waves of wave 3. Yet another 4th wave.

Daily chart:
Hourly chart:


Daily chart with 9 RSI :