Nifty was range bound for the entire day yesterday. It seems to have got support near the developing 5 Day EMA around 5636 - 5645 range. It has also given a positive divergence in the 9 RSI in hourly chart. Only concerning factor in the daily chart the 9 RSI has crossed below the trigger line. If the market turns up violently then this will again cross over above the trigger line. Another interesting factor to observe is, this being the counter trend move, the 14 RSI (hourly chart) has rebounded from 40 range. (actually near 35)
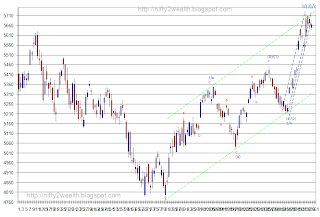
This can be treated as completion of wave 4 of wave 3 of wave C.
Now this gives hope for the the wave 5 of the 3 of C upwards near the 5750 range.
Nifty Daily chart with Elliott Wave labeling:
 Hourly chart:
 Nifty 9 RSI and 35 D on hourly chart:

As a continuation of my study on ATR co-relation to Nifty movement, I have attached the last chart with 7 point ATR and the trigger line. Yesterday it has almost kissed the trigger line. In fact it has done that twice in the current correction phase.

This can be treated as completion of wave 4 of wave 3 of wave C.
Now this gives hope for the the wave 5 of the 3 of C upwards near the 5750 range.
Nifty Daily chart with Elliott Wave labeling:


As a continuation of my study on ATR co-relation to Nifty movement, I have attached the last chart with 7 point ATR and the trigger line. Yesterday it has almost kissed the trigger line. In fact it has done that twice in the current correction phase.

No comments:
Post a Comment