Showing posts with label Heikin Ashi. Show all posts
Wednesday, October 17, 2012
Tuesday, October 16, 2012
Nifty Heikin Ashi candle charts for 16-10-2012
Friday, October 5, 2012
Nifty Heikin Ashi candle chart for 05-10-2012
Thursday, September 27, 2012
Nifty Hekin Ashi candle chart for 27-09-2012
Tuesday, September 25, 2012
Nifty Heikin Ashi candle chart for 25-09-2012
Friday, September 21, 2012
Nifty Heikin Ashi candle chart for 21-09-2012
Tuesday, September 18, 2012
Nifty Heikin Ashi candle chart for 18-09-2012
Monday, September 17, 2012
Nifty Heikin Ashi candle chart for 17-09-2012
Thursday, September 13, 2012
Nifty Heikin Ashi candle chart for 12-09-2012
Thursday, August 30, 2012
Nifty Heikin Ashi candle chart for 30-08-2012
Wednesday, August 29, 2012
Nifty Heikin Ashi candle chart for 29-08-2012
Tuesday, August 28, 2012
Nifty Heikin Ashi candle chart for 28-08-2012
Monday, August 27, 2012
Nifty Heikin Ashi candle chart for 27-08-2012
Friday, August 24, 2012
Nifty Heikin Ashi candle charts for 24-08-2012
Thursday, August 23, 2012
Nifty Heikin Ashi candle chart for 23-08-2012
Wednesday, August 22, 2012
Nifty Heikin Ashi candle chats for 22-08-2012
Tuesday, August 21, 2012
Nifty Heikin Ashi candle chart for 21-082-2012
Friday, August 17, 2012
Nifty Heikin Ashi candle chart for 17-08-2012
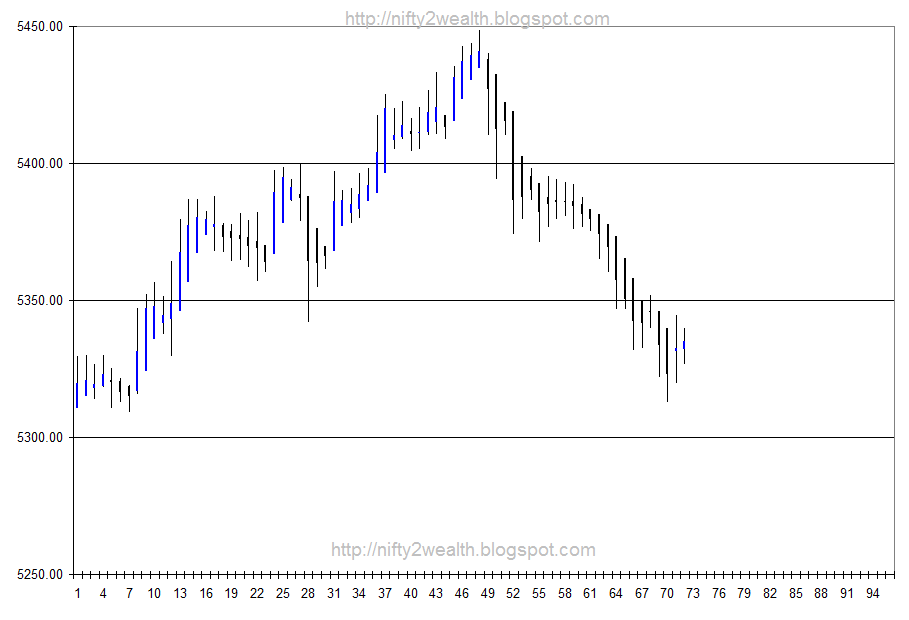
Nifty Daily Heikin Ashi candle chart:
Yesterday daily chart neatly provided support when the market was falling. This can be seen in the daily chart above. The line drawn connecting the tip of the current up move and the bottom of the previous fall acted as the channel support. Need to observe how market will trend today. If market can stay above 5343.71 which is yesterday's Heikin Ashi low, the possibility of up move continues.
Nifty hourly Heikin Ashi candle chart:
Yesterday daily chart neatly provided support when the market was falling. This can be seen in the daily chart above. The line drawn connecting the tip of the current up move and the bottom of the previous fall acted as the channel support. Need to observe how market will trend today. If market can stay above 5343.71 which is yesterday's Heikin Ashi low, the possibility of up move continues.
Nifty hourly Heikin Ashi candle chart:
Thursday, August 16, 2012
Nifty Heikin Ashi candle chart for 16-08-2012
Tuesday, August 14, 2012
Nifty Heikin Ashi candle charts for 14-08-2012
Subscribe to:
Posts (Atom)